Usability vs. Security
About this report
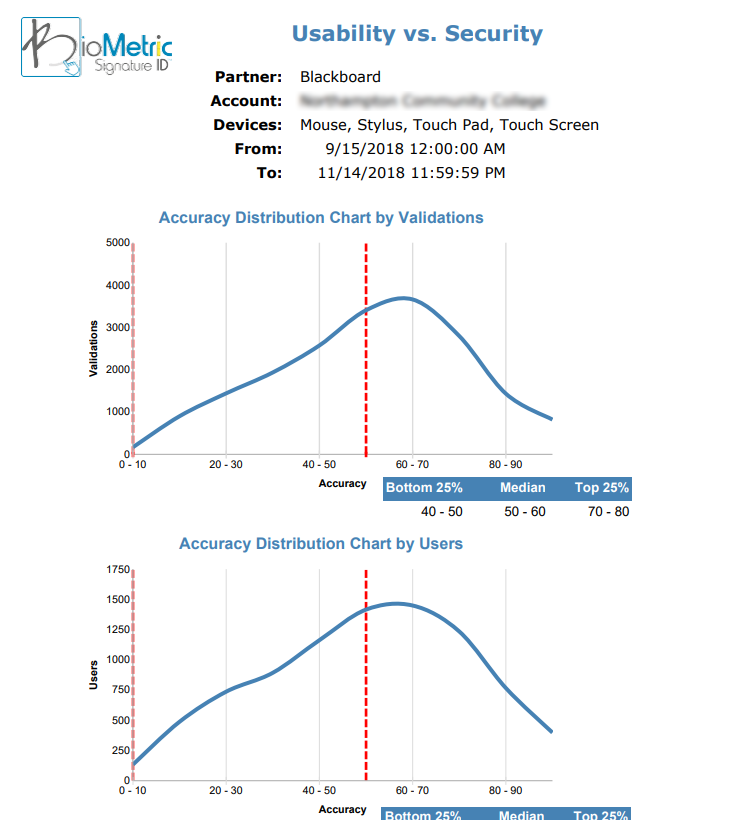
Shows validation accuracy distribution per Partner/Account/Device.
This report monitors whether users are having difficulty in accuracy when using different devices to log in. Compare this report to previous sessions or terms to determining if there is a spike in difficulty with a particular device. To improve usage of a certain device we can provide suggestions on how to use certain devices. For example, if you see a number of users struggling with a mouse we may need to inform them to keep the mouse button held down throughout the entire stroke so that additional lines are not created. If a user lets up on the mouse button during a stroke the system sees an additional line even though this may not be visible to a user causing a validation to fail.
The standard threshold of validation accuracy is 40%, which is configurable per client. For more security, the threshold rate may be increased. This report will help you to determine a level of validation accuracy without impacting usability.
How to run this report
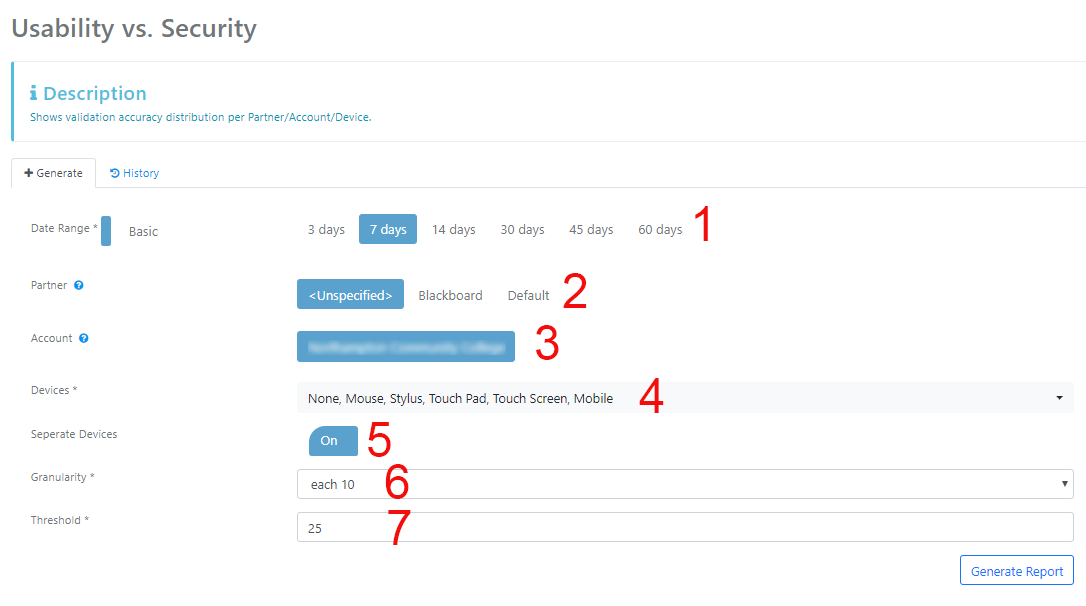
- Date Range - Select one of the predefined dates or click on Basic to change to toggle to Custom
- Partner - Selecting a partner allows the user to filter down to only show the sessions and courses using the selected partner system.
- Account - For client users, the Account will be automatically selected.
- Devices - Select the devices that you would like to view, or leave the default settings to view all devices.
- Separate Devices - Toggle this on/off to show separate device or all devices combined
- Granularity - The level of detail present in the set of data. The default is 10 this can be expanded as desired.
- Threshold - The ability to configure an adjustable group containing users within a specified threshold. This will create a minimum and maximum group.
